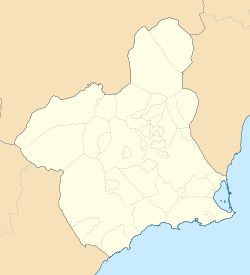
سهخین
Cehegín | |
|---|---|
| موختصاتلار: 38°05′33″N 1°47′56″W / 38.09250°N 1.79889°Wموختصات: 38°05′33″N 1°47′56″W / 38.09250°N 1.79889°W | |
| دۆنیا اؤلکهلری | |
| Autonomous Community | |
| Comarca | Comarca del Noroeste |
| ایداره | |
| • نووع | Mayor-council government |
| • اورقانی | Ayuntamiento de Cehegín |
| • Mayor | José Rafael Rocamora Gabarrón (2015) (PSRM-PSOE) |
| اراضی | |
| • جمع | ۲۹۲٫۷ km2 (۱۱۳�۰ sq mi) |
سهخین (ایسپانجا: Cehegín) ایسپانیادا بیر یاشاییش منطقهسیدیر بۇ شهرین مساحتی ۲۹۲٫۷ کیلومتر موربّع دیر. ۵۷۰ متر دنیز سویهسیندن اۇجالیقی وار. سوْن نۆفوس تخمینلرینه گؤره ۱۵۳۲۱ نفر دیر.
گؤرونتولر
[دَییشدیر]بیرده باخ
[دَییشدیر]قایناقلار
[دَییشدیر]ایسپانیا ویکیپدیاسینین ایشلدنلری طرفیندن یارانمیش«Cehegín»، مقالهسیندن گؤتورولوبدور.( ۷ مارس ۲۰۱۸ تاریخینده یوْخلانیلیبدیر).
| بو شهرلر ایله باغلی مقاله، بیر قارالاما مقاله دیر. بونو گئنیشلندیرمکله ویکیپدیایا کؤمک ائده بیلرسینیز. |
Demographics
[دَییشدیر]Like most towns in the region, Cehegín experienced a big demographic increase until 1940. Right after that there was a notable decline in the 1940s and 1960s, followed by a phase of stability. The current trend is clear growth, but the number of cehegineros who emigrate to other countries is still high. In the district of Valentín (546 inhabitants) an important socio-economic change has taken place with the strong boom experienced by the semi-handicraft industry of clay pottery, destined mainly for export.
| Evolution of Cehegín's Population Throughout the 20th Century[۱] | ||||||||||||||||||
|---|---|---|---|---|---|---|---|---|---|---|---|---|---|---|---|---|---|---|
| 1857 | 1887 | 1900 | 1910 | 1920 | 1930 | 1940 | 1950 | 1960 | 1970 | 1981 | 1991 | ۲۰۰۱ (میلادی) | ۲۰۰۷ (میلادی) | ۲۰۰۹ (میلادی) | ۲۰۱۰ (میلادی) | ۲۰۱۱ (میلادی) | ۲۰۱۲ (میلادی) | ۲۰۱۴ (میلادی) |
| 8.710 | 10.417 | 11.601 | 13.313 | 13.684 | 15.403 | 17.316 | 15.830 | 15.928 | 12.489 | 13.365 | 13.271 | 14.383 | 15.798 | 16.235 | 16.299 | 16.286 | 16.267 | 15.955 |


